The Trust Gap
An interactive data story on the EY 2026 AI Sentiment Report: AI use is outrunning confidence in it. What should business leaders do about that?
- Client / source
- Concept · EY 2026 AI Sentiment Report
- Role
- Concept, Data storytelling, Interaction design
- Tools
- Ceros Flex, Flourish
- 18,152 people surveyed
- 23 markets, Denmark included
- 8 Pioneer markets leading adoption
Try it live
Open full experienceScroll inside the frame, or open the full experience for the best view.
The brief
Survey reports are full of good numbers, and most people never get past the PDF cover. I wanted to take one report and turn it into something a business leader would actually scroll through, and come out of with a clear answer.
The EY 2026 AI Sentiment Report was a good fit. It asked 18,152 people in 23 markets how they use AI and how much they trust it, and the two answers don’t match. That mismatch became the story: AI use is outrunning confidence in it.
The story in five chapters
Each chapter asks one question, answers it in a sentence, and ends with a “so what for leaders” line.
- Everyday AI. How far has AI reached into daily life? 84% of people surveyed used AI in the past six months.
- Assistant to agent. How far will people let AI go? Further than you might think: 16% have already used AI that acts without them.
- Pioneer markets. Where is adoption moving fastest? In eight Pioneer markets, where 94% use AI and 24% have used AI that acts on its own.
- The trust gap. If people use AI this much, do they trust it? Not yet. 73% fear they won’t be able to tell what’s real and what’s AI-generated.
- Closing the gap. What should leaders do about it? Treat trust as a design problem.
Building it in Ceros
The original was built in Ceros Flex, with the charts made in Flourish. Each chapter is its own section in the layer panel, and the layout was designed for desktop, tablet and mobile separately rather than left to reflow.
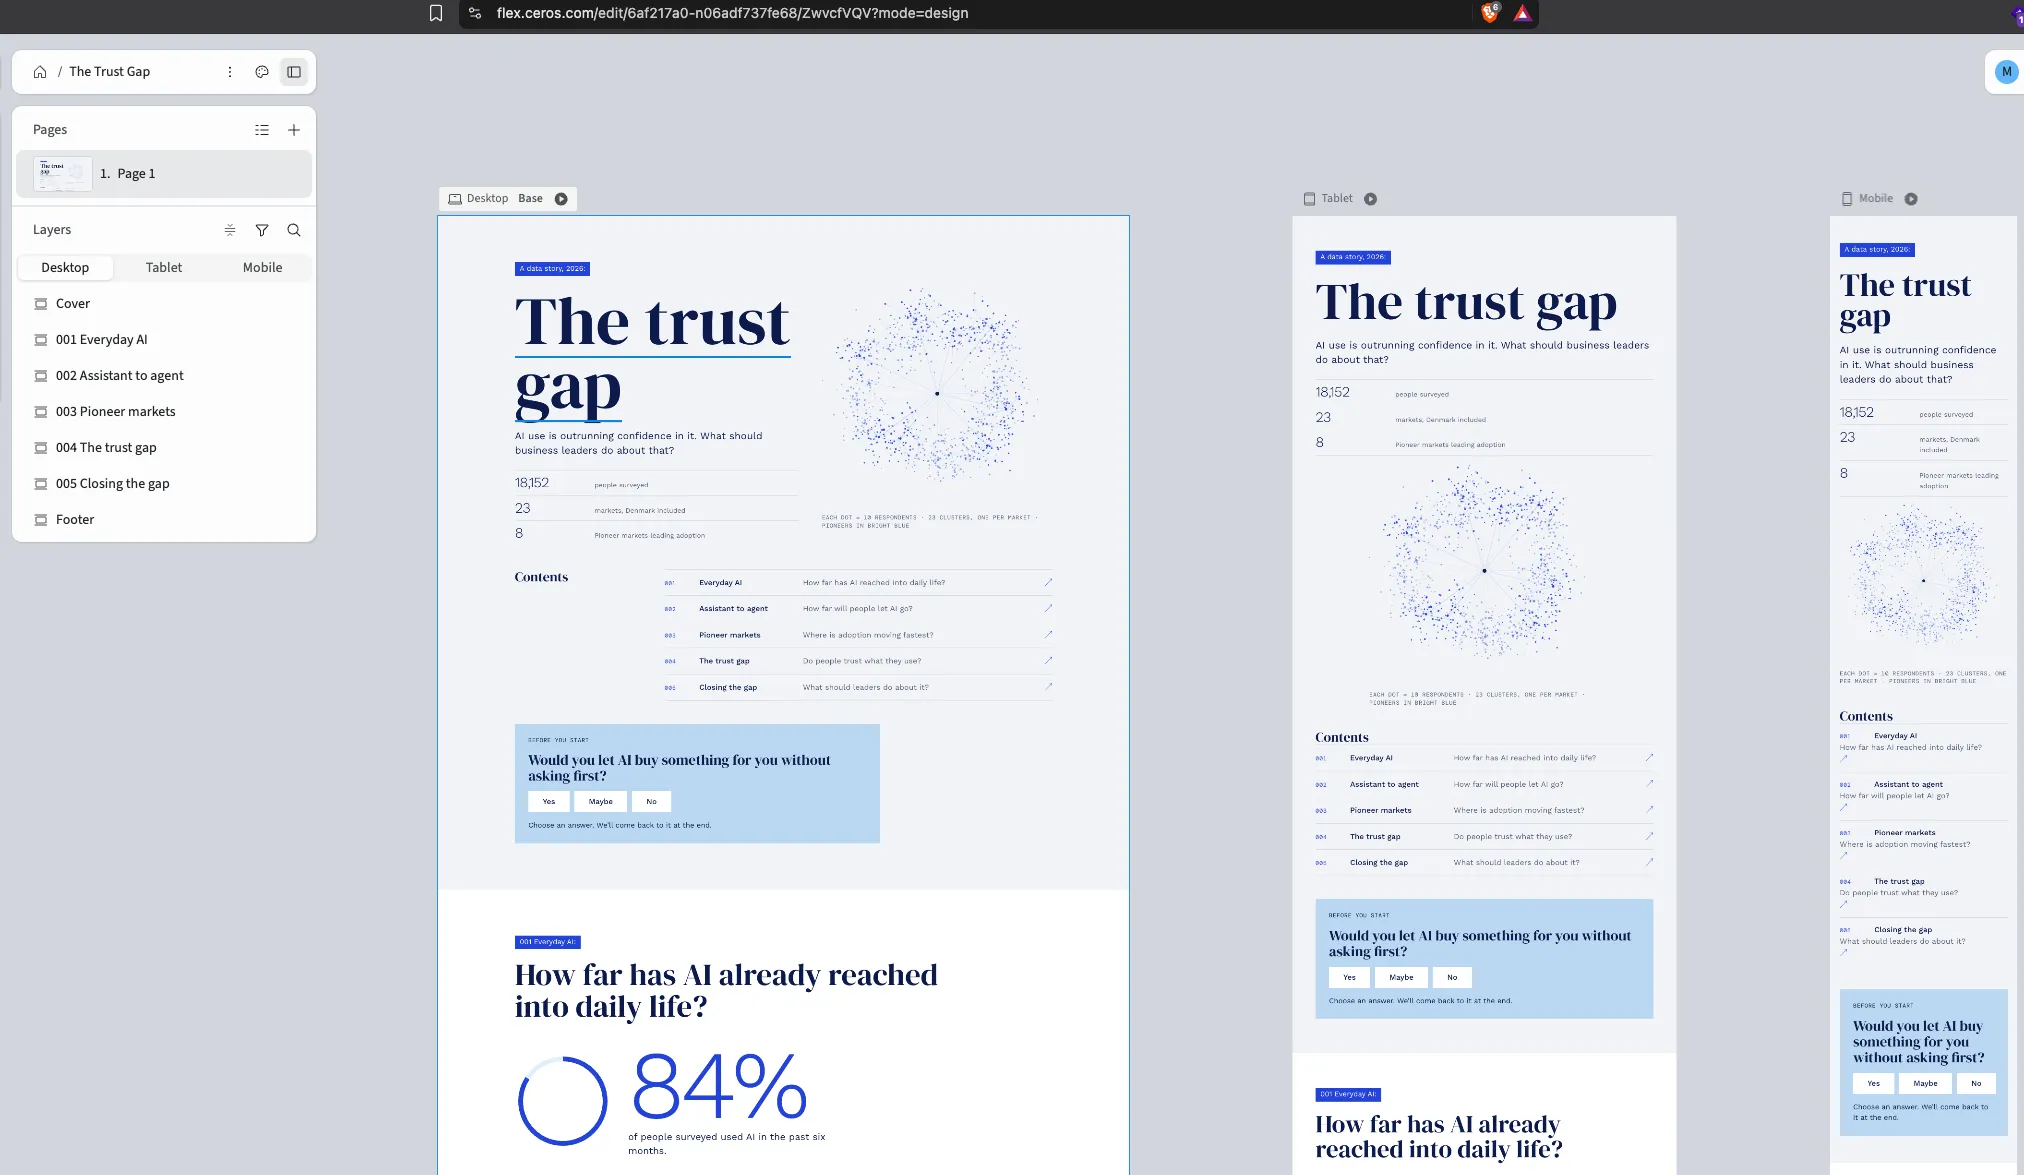
The visual language borrows from an annual report spread: cool paper backgrounds, navy serif headlines, electric blue tags and rules, and light numerals for the big figures. The cover image is a constellation of respondents, one cluster per market, with the eight Pioneer markets in bright blue.
The version embedded above is a standalone HTML recreation, so it can be shared publicly. The charts are redrawn from the Flourish originals, and the interactions mirror the Ceros build.
Interactions that earn attention
Every interaction is there to make the reader take a position before they see the data.
- An opening poll. “Would you let AI buy something for you without asking first?” The answer comes back in the last chapter, next to what the report says.
- A delegation ladder. Seven tasks, ordered from low to high stakes. You pick where you’d stop handing things over, then compare with what people have actually done and what they’d prefer AI to do.
- A market map. All 23 markets, coloured by adoption stage, with a card for each one.
- Real or AI? Two product reviews, one written to sound like AI. Picking one makes the 73% figure personal.
What I’d take from it
A report like this already has the answer. The job is to make people want to find it. Asking a question first, and returning to the reader’s own answer at the end, did more for that than any chart.